
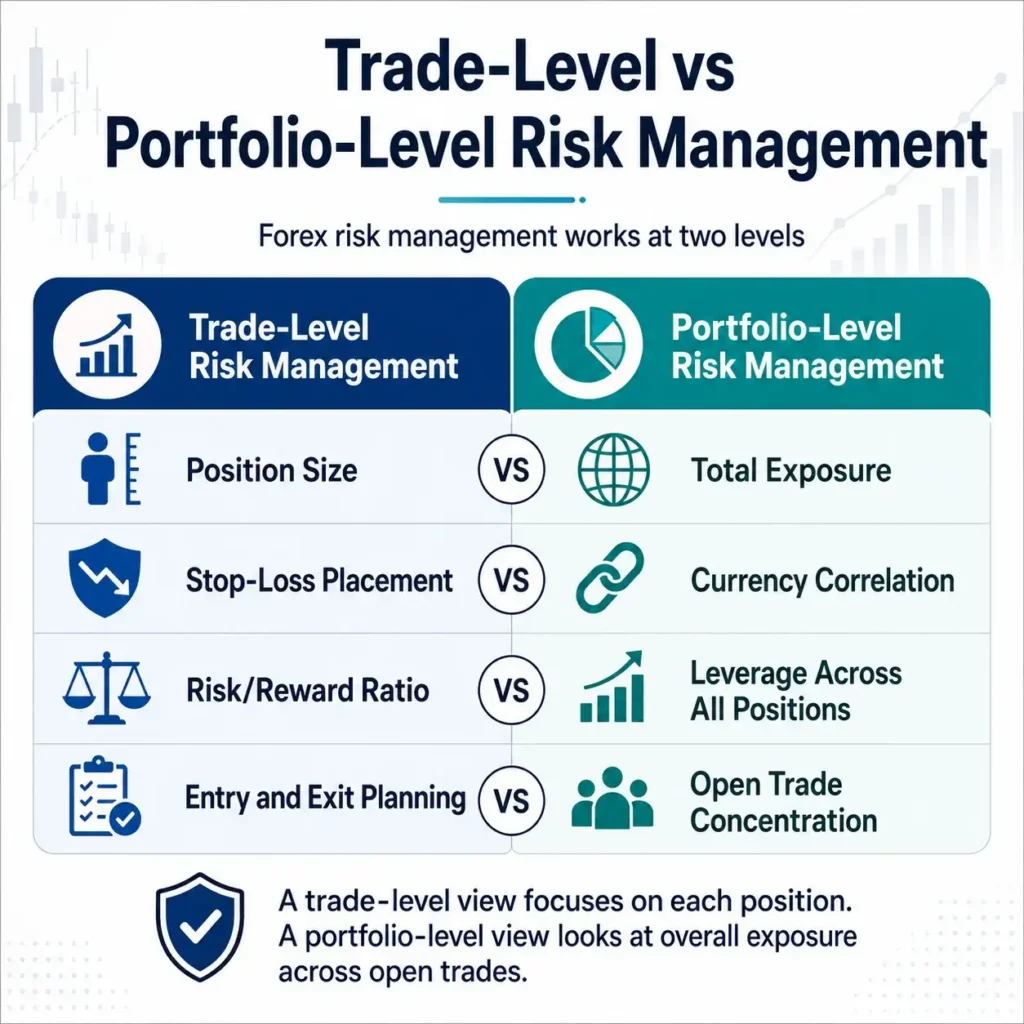
A well-timed entry is only one part of a forex trade. The size of the position, the exit plan and the account’s existing exposure all influence how much money is at risk.
The global foreign exchange market averaged approximately $9.5 trillion in daily turnover during April 2025, according to revised Bank for International Settlements data. That figure covers spot trading and other foreign exchange instruments, rather than retail forex trading alone. bis.org
High trading volume does not make currency trading predictable. Interest-rate decisions, inflation reports, political developments and changes in investor sentiment can move exchange rates quickly.
Forex risk management provides a framework for handling that uncertainty. It combines position sizing, leverage limits, planned exits and regular exposure reviews so that each trade fits within a defined risk budget.
Key Takeaways
- Position sizing connects your account equity, stop-loss distance and planned cash risk.
- A percentage-based guideline, such as the 1% rule, defines an intended risk budget rather than a guaranteed maximum loss.
- Several currency pairs can carry overlapping exposure, especially when they share the same currency.
- Standard stop-loss orders can execute at a worse price than requested during gaps or rapid market movements.
- Effective risk management covers individual positions and the combined exposure of the whole account.
What Is Forex Risk Management?
Forex risk management is the process of identifying potential losses, deciding how much exposure is acceptable and applying rules to manage that exposure.
It begins before a position opens. A trader needs to understand where the trade idea becomes invalid, how much an adverse price movement could cost and whether the position adds to risks already present in the account.
Managing Risk on Individual Trades
At the trade level, risk management involves:
- Establishing an entry and a reason for taking the position.
- Selecting an exit level if the market moves against the trade.
- Calculating a position size that fits the planned risk budget.
- Allowing for trading costs and uncertain execution.
These decisions connect the trading idea to its financial consequences.
Managing Risk Across the Account
At the account level, the focus shifts to combined exposure.
Several trades may each appear manageable while collectively creating a large bet on one currency, economic announcement or market theme.
Account-level risk management therefore includes monitoring total leverage, available margin, correlated positions and losses relative to previous equity levels.
Main Types of Forex Risk
Different risks require different controls. A stop-loss order, for example, addresses an adverse price move but does not resolve every issue involving liquidity, financing or account exposure.
Market Risk
Market risk is the possibility that an exchange rate moves against your position.
Currency prices respond to economic expectations as well as published results. An inflation report can meet its headline forecast and still move the market if its underlying details change expectations for interest rates.
Position sizing and planned exits help manage the financial impact of an unfavorable move. Reviewing scheduled announcements also helps identify periods when execution may become less predictable.
Leverage Risk
Leverage allows a trader to control a position larger than the equity supporting it. This increases the account impact of changes in the position’s value.
Suppose an account has $1,000 in equity and holds a position worth $30,000. Its effective leverage is 30:1.
A 1% adverse change in that position’s value represents approximately $300, equivalent to 30% of the account’s starting equity, before costs.
The CFTC warns that leveraged OTC forex trading can result in the loss of all margin funds and, where applicable protections do not prevent it, additional losses beyond the initial deposit. www.cftc.gov
Margin Requirements Do Not Define Your Risk Budget
Margin is the amount required to open and maintain a position. It should not be confused with the amount you can afford to lose.
If account equity falls below a broker’s maintenance requirements, the broker may issue a notification or automatically close positions under its account rules. A margin closeout does not universally guarantee protection against a negative balance.
Liquidity and Execution Risk
Liquidity risk arises when there is insufficient available trading interest to execute the desired size near the expected price.
This can produce:
- Wider bid–ask spreads.
- Partial or delayed execution, depending on the platform.
- Slippage between the expected and actual fill price.
- Difficulty exiting a large position during stressed conditions.
Major currency pairs generally have deeper markets than less frequently traded pairs, but they can still experience poor execution around unexpected news or sharp price movements.
Trade size and timing should account for those possibilities.
Currency Correlation Risk
Currency correlation describes how the returns of two pairs have moved relative to each other over a measured period.
The practical issue is overlapping exposure. Buying EUR/USD, GBP/USD and AUD/USD creates three positions that can all be hurt by broad US dollar strength.
| Position combination | Shared exposure | Risk consideration |
|---|---|---|
| Long EUR/USD and long GBP/USD | Both sell USD against another currency | Broad dollar strength can affect both positions |
| Long AUD/USD and long NZD/USD | Both sell USD and involve currencies sensitive to some shared economic drivers | Losses may occur together during a common market move |
| Long EUR/USD and short USD/CHF | Both positions sell USD | Opposite trade directions on the platform can still reinforce dollar exposure |
| Long USD/JPY and long USD/CHF | Both buy USD | A broad dollar decline can affect both trades, even when JPY and CHF behave differently |
Historical correlations are not fixed. Their strength and direction depend on the measurement period and market conditions.
Checking the currency bought and sold in each position is often a useful first step before relying on a correlation matrix.
Overnight Financing and Holding Risk
Holding a position beyond a broker’s rollover time may create a financing charge or credit.
The amount depends on the instrument, trade direction and broker’s pricing methodology. Interest-rate differences are relevant, but broker adjustments and other contract terms can also affect the final rate.
Review:
- The current long and short financing rates.
- The rollover schedule.
- Any multiple-day financing adjustments.
- How accumulated charges affect the planned trade outcome.
Overnight price risk is a separate concern. A trade can face adverse news while it remains open, regardless of whether it receives a financing credit.
Position Sizing and the 1% Rule
Position sizing determines the quantity traded. Its purpose is to connect the distance to your planned exit with an acceptable cash risk.
A percentage-based approach starts with account equity:
Planned cash risk = Account equity × Risk percentage
Equity includes unrealized gains and losses, making it a more current reference than balance alone when positions are open.
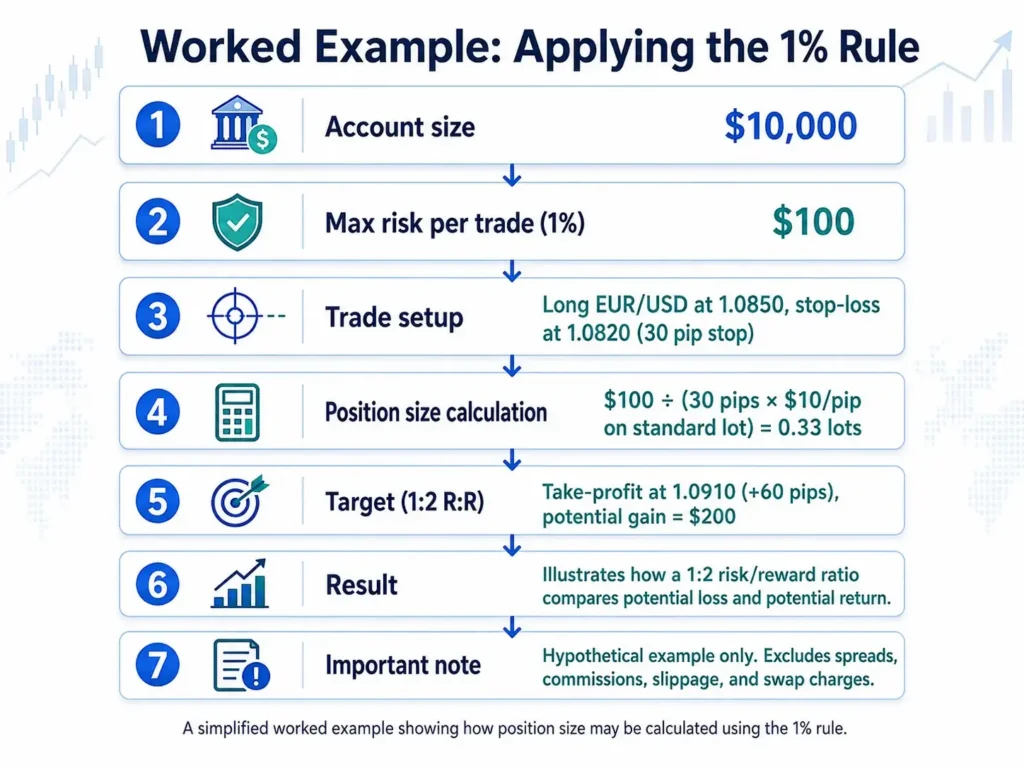
The 1% rule uses 1% of equity as an intended risk budget for a single trade. It is an illustrative guideline, not a universally suitable or safe allocation.
Worked Example: Calculating a Forex Position
Assume:
| Input | Example |
|---|---|
| Account equity | $10,000 |
| Chosen risk percentage | 1% |
| Planned cash risk | $100 |
| Currency pair | EUR/USD |
| Account currency | USD |
| Stop-loss distance | 30 pips |
| Pip value per standard lot | $10 |
For a standard EUR/USD contract of 100,000 units:
Position size = Cash risk ÷ (Stop distance × Pip value per standard lot)
Therefore:
$100 ÷ (30 × $10) = 0.3333 standard lots
If the broker permits increments of 0.01 lots, rounding down to 0.33 lots produces a planned price loss of:
30 pips × $3.30 per pip = $99
This excludes commissions and adverse execution. If $100 is the intended total budget, room must be allowed for those costs.
Pip values differ across currency pairs and account currencies. Check the contract specification rather than applying the EUR/USD assumption to every instrument.
Why the Stop Distance Matters
A wider stop requires a smaller position when the cash risk budget remains unchanged.
Using the same $100 budget:
| Stop distance | Calculated position size before costs |
|---|---|
| 20 pips | 0.50 lots |
| 40 pips | 0.25 lots |
| 50 pips | 0.20 lots |
Choose an exit level that makes sense for the strategy, then calculate the position size around it.
Understanding Risk-to-Reward Ratios
A risk-to-reward ratio compares the planned loss with the target profit.
A trade with a 50-pip stop and a 100-pip target has a 1:2 risk-to-reward ratio, assuming the same position size throughout.
That ratio describes the proposed trade structure. It does not tell you how likely the target is to be reached.
Break-Even Win Rates
Under simplified conditions with fixed wins and losses:
Break-even win rate = Risk ÷ (Risk + Reward)
| Risk-to-reward ratio | Break-even win rate before costs |
|---|---|
| 1:0.5 | 66.67% |
| 1:1 | 50% |
| 1:2 | 33.33% |
| 1:3 | 25% |
Spreads, commissions, financing and slippage raise the required win rate.
Actual average wins and losses matter more than targets on a chart. Closing profitable trades early or allowing losses to exceed their planned size can materially change the results.
Stop-Loss Orders in Forex Trading
A stop-loss establishes a trigger for exiting an unfavorable position. It supports a planned trading process, but its effectiveness depends on the order type and execution conditions.
| Stop type | How it works | Main limitation |
|---|---|---|
| Standard stop-loss | Triggers an exit when the specified price condition is met | The fill can be worse than the trigger price |
| Trailing stop | Adjusts the stop as price moves favorably, according to defined settings | Can trigger during temporary reversals and remains subject to execution conditions |
| Guaranteed stop | Provides the contracted exit price under the provider’s terms | Availability, premiums and restrictions vary |
Placing Stops Around the Trading Idea
A stop may be placed beyond a relevant support or resistance level, outside a recent price swing or at a distance determined by a tested volatility rule.
The important question is: At what point would the original reason for entering no longer hold?
A stop placed too close may be triggered by ordinary price movement. A wider stop increases the cash loss unless position size is reduced.
Why Moving a Stop Can Increase Risk
Widening a stop after entry changes the original risk calculation.
For example, moving a stop from 30 to 60 pips doubles the planned price loss if the position remains the same size.
Any adjustment should follow a predefined strategy and include a new exposure calculation.
Diversification and Total Forex Exposure
Diversification involves spreading exposure across different drivers rather than simply increasing the number of open trades.
Three positions can share one main vulnerability. Conversely, two positions can partially offset one currency exposure while introducing other risks.
Before adding a position, consider:
- Which currency you are buying.
- Which currency you are selling.
- Whether existing trades express the same view.
- Which announcement could affect several positions together.
- The combined planned loss if multiple stops are triggered.
Example of Combined Trade Risk
Suppose three open trades each carry a planned stop-based risk of 1% of equity.
Their combined planned risk is approximately 3% before costs and execution differences. If the trades share a common driver, their losses may occur together.
Diversification can reduce concentration, but it cannot replace suitable position sizing.

Managing Risk Around Economic Events
Economic releases can change expectations for growth, inflation and monetary policy. Currency prices may react within seconds.
An economic calendar helps identify scheduled events such as:
- Central bank rate decisions and press conferences.
- Inflation reports.
- Employment releases, including US non-farm payrolls.
- GDP announcements.
- Major policy statements.
The calendar provides timing, not certainty about direction or the size of a move.
News-Related Execution Risk
During an important release, spreads may widen and available prices may change rapidly. A stop can execute beyond its trigger even when the market remains open.
Review the position’s size, stop assumptions and combined exposure before the announcement.
Weekend Gap Risk
Most retail forex trading pauses over the weekend. Political events, policy developments or other news can change currency valuations before trading resumes.
The next available price may differ substantially from the previous close. Holding a position through that interruption therefore requires an allowance for uncertain execution.
Building a Forex Risk Management Strategy
A useful strategy turns broad intentions into rules that can be applied consistently.
Set Written Risk Parameters
Define the account’s approach to:
- Planned risk per trade.
- Maximum combined open-position risk.
- Effective leverage.
- Daily or weekly loss limits.
- Drawdown review levels.
- Trading around news and market closures.
A loss limit creates a stopping or review point. It cannot guarantee that actual losses remain below that number if markets gap or execution deteriorates.
Match the Trading Style to Your Circumstances
Different approaches create different monitoring and holding requirements.
| Trading style | Typical holding period | Main risk considerations |
|---|---|---|
| Day trading | Within a session | Execution costs, intraday volatility and active monitoring |
| Swing trading | Several days or longer | Overnight financing, news exposure and weekend gaps |
| Position trading | Weeks or months | Extended exposure, policy changes and accumulated financing costs |
A style should fit the time available to manage it and the ability to tolerate its losses. Shorter holding periods do not automatically mean lower risk.
Review Drawdown Before Increasing Exposure
Drawdown measures a decline from an earlier equity peak.
Drawdown = (Peak equity − Current equity) ÷ Peak equity × 100
If equity falls from $10,000 to $9,000, the drawdown is 10%. Recovering requires an 11.11% gain on the remaining $9,000.
Written review rules can help identify whether the decline reflects ordinary strategy variation, execution problems or repeated departures from the plan.
Common Forex Risk Management Mistakes
| Mistake | Why it matters | Practical response |
|---|---|---|
| Using excessive leverage | Small market changes can have a large equity impact | Calculate total exposure before entry |
| Choosing lot size without checking stop distance | The potential cash loss becomes unclear | Calculate position size from the risk budget |
| Increasing risk to recover losses | A difficult period can become more damaging | Follow predetermined sizing and review rules |
| Ignoring shared currency exposure | Several trades may lose together | Review the currencies bought and sold |
| Widening stops without recalculating risk | The position can exceed its original budget | Reassess size and total exposure |
| Ignoring financing and transaction costs | Net results can differ sharply from chart-based estimates | Include costs in planning and reviews |
| Abandoning rules during volatility | Decisions become inconsistent under pressure | Define event and stopping rules in advance |
Useful Forex Risk Management Tools
Tools improve consistency when their inputs and limitations are understood.
| Tool | Purpose | What to check |
|---|---|---|
| Position-size calculator | Estimates trade quantity from risk and stop distance | Account currency, contract size and rounding |
| Pip-value calculator | Converts pip movement into account-currency value | Currency conversion assumptions |
| Margin calculator | Estimates required margin | Broker-specific requirements |
| Economic calendar | Identifies scheduled announcements | Time zone and release timing |
| Correlation matrix | Measures historical relationships | Lookback period and changing correlations |
| Margin monitor | Tracks equity and available margin | Closeout thresholds and total exposure |
| Trading journal | Records decisions and outcomes | Actual costs, fills and rule compliance |
| Charting platform | Displays planned entries and exits | Correct instrument and price feed |
A margin calculator answers how much collateral a trade requires. A position-size calculator answers a different question: what quantity fits the intended risk budget?
Using a Trading Journal to Improve Risk Decisions
A journal connects the original plan with what happened.
Record the currency pair, direction, entry, position size, stop, target and planned cash risk. After closing, add the actual exit, costs, slippage and reason for any changes.
Review Process as Well as Profit
Useful review questions include:
- Did the position fit the intended risk budget?
- Was a stop moved beyond its original level?
- Did existing trades create overlapping exposure?
- Were costs higher than expected?
- Did the trade comply with the written plan?
A profitable trade can involve poor risk decisions. A losing trade can follow the process correctly. Reviewing both helps avoid drawing conclusions from the outcome alone.
Trading Psychology and Risk Management
Fear, frustration and overconfidence can interfere with a technically sound plan.
After a loss, the urge to recover quickly may lead to larger positions or lower entry standards. After several wins, confidence may encourage more exposure than the account rules allow.
A winning streak does not make the next loss inevitable. It also does not prove that increasing risk is justified.
Practical controls include preparing orders before entry, using consistent sizing rules, observing session limits and reviewing departures from the plan.
Practising Risk Management on a Demo Account
A demo account provides a place to practise platform mechanics without committing real trading funds.
It can help test whether you can:
- Calculate position size correctly.
- Place and modify orders.
- Monitor combined exposure.
- Understand margin displays.
- Follow a written trading routine.
Use a simulated balance and trade sizes that resemble the intended live setup. An unrealistically large demo balance can hide sizing problems.
Demo execution, financing treatment and emotional pressure can differ from live trading. Simulated success does not establish future profitability.
Maintaining a Consistent Risk Management Process
Forex risk management requires regular review. Account equity changes, positions overlap and market conditions evolve.
Before each trade, check the planned cash loss and its effect on total exposure. During the trade, monitor relevant events and margin conditions. Afterward, compare the actual execution with the original assumptions.
The aim is to make exposure deliberate and measurable while recognizing that losses can still exceed expectations.
Frequently Asked Questions
What Is Risk Management in Forex Trading?
It is the process of identifying and managing potential trading losses through position sizing, planned exits, leverage controls and account-level exposure limits.
What Is the 1% Rule in Forex?
The 1% rule uses 1% of current equity as a planned risk budget for one trade. On a $10,000 account, that budget is $100. Actual losses may exceed it because of costs, gaps or slippage.
How Do You Calculate Forex Position Size?
Divide the planned cash risk by the stop distance multiplied by the pip value per lot:
Position size = Cash risk ÷ (Stop distance × Pip value per lot)
Use the correct contract specification and convert pip value into the account currency.
Can a Stop-Loss Prevent Every Large Loss?
A standard stop-loss cannot guarantee the execution price. Rapid moves and gaps can produce a worse fill. Guaranteed stops, where offered, are governed by the provider’s terms.
How Does Currency Correlation Affect Risk?
Positions with shared currency exposure may gain or lose together. Historical correlation can help identify relationships, but it changes over time and should be assessed alongside the direction and size of each position.
Is a 1:2 Risk-to-Reward Ratio Profitable?
It depends on the actual win rate, average realized wins and losses, and trading costs. With fixed 1:2 outcomes, the theoretical break-even win rate is 33.33% before costs.
Does Risk Management Guarantee Trading Success?
No. Risk controls help manage exposure and support consistent decisions. They cannot eliminate losses or make a strategy with no reliable advantage profitable.
Risk notice: Leveraged forex and CFD trading can cause substantial losses. This article provides general educational information; its examples do not account for your financial circumstances and are not personalized investment advice.